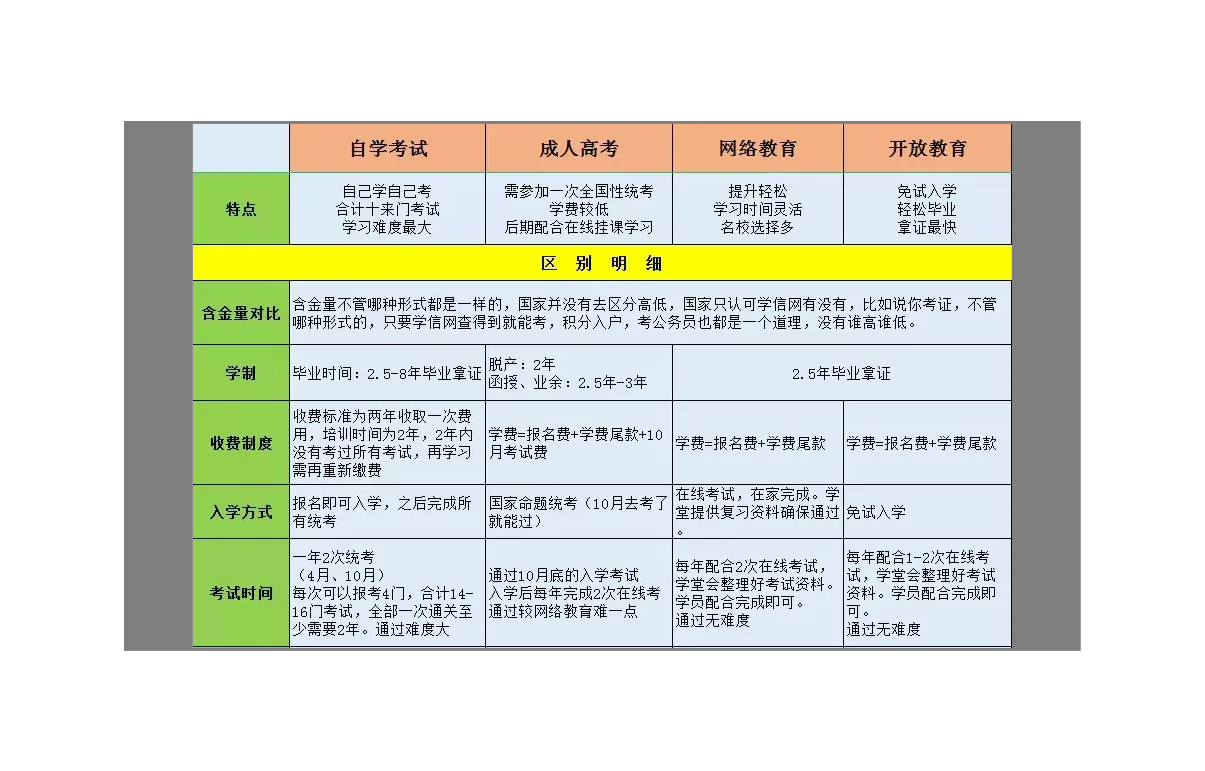
python——画t-sne图(含代码)
t-sne是一种数据可视化的工具,可以把高维数据降到2-3维,然后画成t-sne图可视化出来。
如下图所示:
这种方法在很多情况下可以很清晰地表示出数据的分布,因此被广泛使用。
在中也可以直接用代码画出t-sne,话不多说直接上代码:
from sklearn import datasets
from openTSNE import TSNEimport tsneutilimport matplotlib.pyplot as plt
iris = datasets.load_iris()
x, y = iris["data"], iris["target"]tsne = TSNE(perplexity=50,n_iter=500,metric="euclidean",# callbacks=ErrorLogger(),n_jobs=8,random_state=42,
)
embedding = tsne.fit(x)
tsneutil.plot(embedding, y, colors=tsneutil.MOUSE_10X_COLORS)print('end')
其中需要 。代码如下:
from os.path import abspath, dirname, joinimport numpy as np
import scipy.sparse as spFILE_DIR = dirname(abspath(__file__))
DATA_DIR = join(FILE_DIR, "data")MOUSE_10X_COLORS = {0: "#FFFF00",1: "#1CE6FF",2: "#FF34FF",3: "#FF4A46",4: "#008941",5: "#006FA6",6: "#A30059",7: "#FFDBE5",8: "#7A4900",9: "#0000A6",10: "#63FFAC",11: "#B79762",12: "#004D43",13: "#8FB0FF",14: "#997D87",15: "#5A0007",16: "#809693",17: "#FEFFE6",18: "#1B4400",19: "#4FC601",20: "#3B5DFF",21: "#4A3B53",22: "#FF2F80",23: "#61615A",24: "#BA0900",25: "#6B7900",26: "#00C2A0",27: "#FFAA92",28: "#FF90C9",29: "#B903AA",30: "#D16100",31: "#DDEFFF",32: "#000035",33: "#7B4F4B",34: "#A1C299",35: "#300018",36: "#0AA6D8",37: "#013349",38: "#00846F",
}def plot(x,y,ax=None,title=None,draw_legend=True,draw_centers=False,draw_cluster_labels=False,colors=None,legend_kwargs=None,label_order=None,**kwargs
):import matplotlibif ax is None:_, ax = matplotlib.pyplot.subplots(figsize=(8, 8))if title is not None:ax.set_title(title)plot_params = {"alpha": kwargs.get("alpha", 0.6), "s": kwargs.get("s", 1)}# Create main plotif label_order is not None:assert all(np.isin(np.unique(y), label_order))classes = [l for l in label_order if l in np.unique(y)]else:classes = np.unique(y)if colors is None:default_colors = matplotlib.rcParams["axes.prop_cycle"]colors = {k: v["color"] for k, v in zip(classes, default_colors())}point_colors = list(map(colors.get, y))ax.scatter(x[:, 0], x[:, 1], c=point_colors, rasterized=True, **plot_params)# Plot mediodsif draw_centers:centers = []for yi in classes:mask = yi == ycenters.append(np.median(x[mask, :2], axis=0))centers = np.array(centers)center_colors = list(map(colors.get, classes))ax.scatter(centers[:, 0], centers[:, 1], c=center_colors, s=48, alpha=1, edgecolor="k")# Draw mediod labelsif draw_cluster_labels:for idx, label in enumerate(classes):ax.text(centers[idx, 0],centers[idx, 1] + 2.2,label,fontsize=kwargs.get("fontsize", 6),horizontalalignment="center",)# Hide ticks and axisax.set_xticks([]), ax.set_yticks([]), ax.axis("off")if draw_legend:legend_handles = [matplotlib.lines.Line2D([],[],marker="s",color="w",markerfacecolor=colors[yi],ms=10,alpha=1,linewidth=0,label=yi,markeredgecolor="k",)for yi in classes]legend_kwargs_ = dict(loc="center left", bbox_to_anchor=(1, 0.5), frameon=False, )if legend_kwargs is not None:legend_kwargs_.update(legend_kwargs)ax.legend(handles=legend_handles, **legend_kwargs_)matplotlib.pyplot.show()
tags:
t-sne